Description: In the post we'll continue the legacy of Part 1 :-) . Below are some tips and tricks which would come much handy and useful during our app development cycle.
So lets get started :-)
Note : If you have missed part 1. Please refer here
You can also use command line code to do that.
\tool\proguard\bin> retrace.bat -verbose (path_to_mapping.txt)\mapping.txt (path_to_stacktrace)\crash.txt
Thus just applying some simple tricks and tips really make a difference in the speed of development.
For more updates follow us on - Twitter
So lets get started :-)
Note : If you have missed part 1. Please refer here
1. Capture or record screen without any external app.
Often we require to take snapshot of the app's screen or even record a video to show some features to colleagues or QA or Client . It comes handy very often.
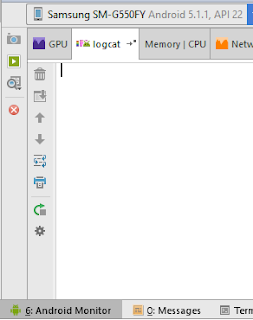
Step 1: Simply connect your device. Open Android Monitor from android studio you'll see as fig.1.
 |
| fig.1 |
Step 2: Now, you can open your app and click on the camera icon from android monitor located to the extreme top-left corner to capture any screen you want. Bingo !!!
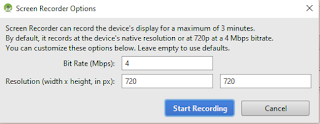
For video: Click video icon below the camera icon. Enter the resolution with multiples of 16x. fig.2. That's it. It'll start recording your action's on the app.
 |
| fig.2 |
2. How to find layout boundaries?
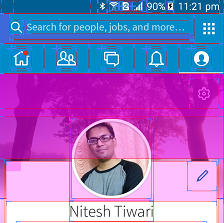
Layout boundaries are very useful when we develop our UI components. It gives a real sense to layout, thereby letting us to study arrangement of different widgets in the layout.
Step 1: Open Settings --> Developer Options --> Show layout boundaries. From drawing section
 |
| fig.3.LinkedIn app |
fig.3. A Simple analysis for pencil icon. (without opening our layout)
1. Edit pencil icon has some padding to itself.
2. Its align to top-right corner to its parent layout.
Really awesome.
3. Simplest way to decode obfuscated code?
As we know, code are obfuscated when we build our apk with proguard enabled. We often come in contact with obfuscated code in our app while debugging the stacktrace of the crashes.
So decoding is very much needed to study the stackstrace. Android build's a file called as "mapping.txt" which serves as the key ingredient to decode, in combination of "retrace".
In Windows
Step 1: Go to (android-studio-install-dir-path)\tools\proguard\bin open "proguardgui.bat" fig.4
 |
| fig.4 |
Step 2: Click on "ReTrace" fig.5. and upload your "mapping.txt" file from app/build/outputs/mapping/.../mapping.txt and the obfuscated code file (e.g: crash.txt). You can also simply paste the stackstrace in the box provided.
Note: If you do not find mapping.txt. You have to generate a signed apk with proguard enabled("minifyenabled true" within the app's build.gralde).
 |
| fig.5 |
\tool\proguard\bin> retrace.bat -verbose (path_to_mapping.txt)\mapping.txt (path_to_stacktrace)\crash.txt
Thus just applying some simple tricks and tips really make a difference in the speed of development.
For more updates follow us on - Twitter
#codingIsAnArt
#coderconsole
#coderconsole


